Sue Lee, Week #5, More Coding, More Math
This week, I have finally finished my project on writing a code to convert a visual representation of an SEM image into a binary state array. With the coordinate points of the post centers I’ve found by using the tool ‘centroids’, I continued to write a code that computed the x and y coordinates of the states (the positions between each two adjacent posts). This way, I could inspect the area surrounding the state to determine whether there is a connection or not between the two posts.


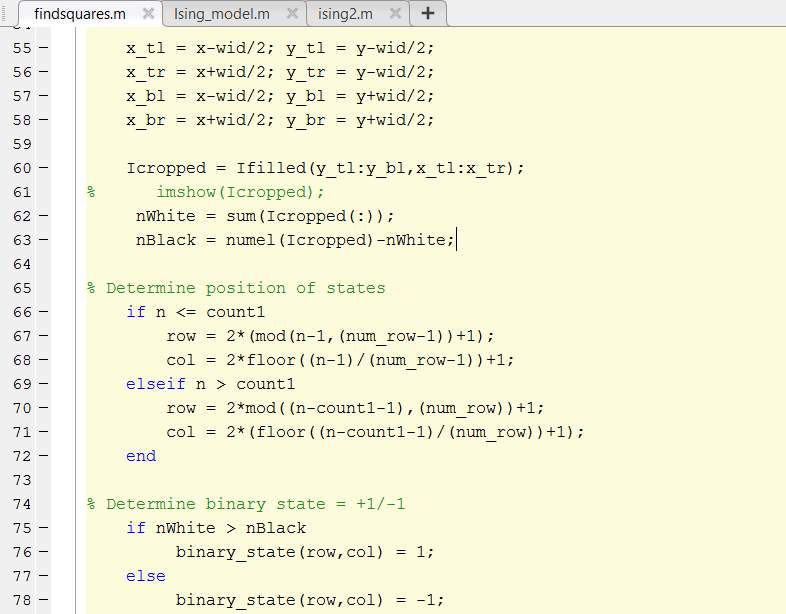
This was fairly easy, as it was simply taking the coordinate points of the posts and averaging them to find the midpoint between each two adjacent posts. The tricky part was dividing the cases into two: one where the state was located between two left-right posts and two top-bottom posts. After I figured this part out, the rest was fairly easy, and I was able to obtain all 351 coordinate points of the states. Now that I knew the coordinate points of the states, I wanted to cut out small squares around the states in which I could determine whether the white or the black pixels were the majority. I made it so that each square had a width of 20. To create these squares, I had to compute the coordinate points of the vertices of the square by using the coordinate points of the states I had found earlier. The most difficult part about the project was determining the position (row and column) of the states. I only knew the order of the states (nth state) ranging from 1-351, but I needed to know the (row,column) coordinates of each state to assign each location a +1 or -1 state. I had to be able to detect the pattern and relationship between the "n" values and the row and column values. This took me a good amount of internal screaming to be able to figure out which functions to use in what way to assign the appropriate row and column values to each state. After much trial and error and pages of scribbling in my notebook, I finally learned to use the "mod" and "floor" functions to find the equations for both row and column.
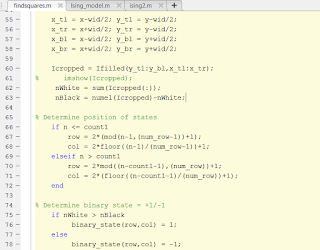
Then I wrote some more code that determined the number of black and white pixels in each designated square. If the majority of pixels were black, there was no connection between the two posts and the state would be assigned a -1 value, and if the majority was white, vice versa, Now, I used these row and column location values to assign these +1 and -1 values to their designated locations within a 19 x 37 binary array. And I thought I was done! But my graduate student pointed out that I should convert the binary array into a visual representation so that it would be easier for me to determine whether the code had worked successfully and the binary array was indeed a numerical representation of the given block copolymer pattern. So I worked on another code that worked on converting the array into an ideal visual representation.


This was fairly easy, as it was simply taking the coordinate points of the posts and averaging them to find the midpoint between each two adjacent posts. The tricky part was dividing the cases into two: one where the state was located between two left-right posts and two top-bottom posts. After I figured this part out, the rest was fairly easy, and I was able to obtain all 351 coordinate points of the states. Now that I knew the coordinate points of the states, I wanted to cut out small squares around the states in which I could determine whether the white or the black pixels were the majority. I made it so that each square had a width of 20. To create these squares, I had to compute the coordinate points of the vertices of the square by using the coordinate points of the states I had found earlier. The most difficult part about the project was determining the position (row and column) of the states. I only knew the order of the states (nth state) ranging from 1-351, but I needed to know the (row,column) coordinates of each state to assign each location a +1 or -1 state. I had to be able to detect the pattern and relationship between the "n" values and the row and column values. This took me a good amount of internal screaming to be able to figure out which functions to use in what way to assign the appropriate row and column values to each state. After much trial and error and pages of scribbling in my notebook, I finally learned to use the "mod" and "floor" functions to find the equations for both row and column.

So you can see, it worked!

But just in case, I substituted another block copolymer pattern to see if the code would work for any other picture. To my relief, it worked again! On Thursday, we had our group meeting where me, a postdoctoral associate, and a graduate student presented. The postdoctoral associate talked about the Quantum Electron Microscope, an incredibly complicated device he's been working on for the past 4-5 years. It was inspiring to see how much time and effort my lab members devote to their work - the postdoc had made nearly 50 sketches of the device - and I learned that it's not all about success.
This weekend, my family and I had lunch at my favorite restaurant (thus far) in Boston, Gyu-Kaku. We walked around Boston University and read at Barnes & Nobles - great way to spend my last weekend here.
This weekend, my family and I had lunch at my favorite restaurant (thus far) in Boston, Gyu-Kaku. We walked around Boston University and read at Barnes & Nobles - great way to spend my last weekend here.


Comments
Post a Comment